Objective: The objective of this blog post is to provide a comprehensive guide on how to integrate Mendix applications with Tableau to unlock valuable insights from data. It aims to empower developers, business analysts, and decision-makers with the knowledge and tools needed to seamlessly connect their Mendix-generated data with Tableau's powerful data visualization and analytics capabilities.
As a Mendix developer, I have integrated various applications into my Mendix projects to enhance their features. Mendix provides a variety of resources to help developers integrate applications with other systems and platforms. These resources include built-in tools, connectors, documentation, and community support. Here are some key resources provided by Mendix for integration:
-
SAP OData Connector: Integrate with SAP systems using OData services.
-
REST Services: Pre-built modules for consuming and exposing REST APIs.
-
SOAP Services: Tools for integrating with SOAP-based web services.
-
Database Connectors: Integrate with various databases (e.g., PostgreSQL, MySQL, SQL Server).
Mendix offers various resources to integrate different applications. My question is does Mendix provide any tools or resources to integrate Mendix data into applications like PowerBI, Tableau for data visualization?
The answer is yes, Mendix offers the following resources to share Mendix data with different applications.
-
Published REST Services
- Published OData Services
Published REST Services:
Publishing REST services in Mendix allows your Mendix applications to expose their data and functionality to other systems over HTTP. This enables seamless integration with external applications and services, facilitating data sharing and interoperability. Here's a detailed guide on how to publish REST services in Mendix.
Published OData Services:
Publishing OData services in Mendix allows your Mendix applications to expose their data models as OData endpoints. OData (Open Data Protocol) is a standardized protocol for building and consuming RESTful APIs, enabling easy data sharing and integration with various applications and systems, including SAP, Microsoft Dynamics, and others.
To know more about the Mendix Rest Services and OData services go through the following link:
https://docs.mendix.com/refguide/integration/OData-services/
What is Tableau?
Tableau is a powerful data visualization and business intelligence (BI) tool that helps people see and understand their data. It allows users to create a wide range of visualizations, from simple charts and graphs to complex dashboards and interactive reports, which can be used to gain insights, make data-driven decisions, and communicate findings effectively.
Key Features of Tableau:
Data Connectivity:
-
Connects to a wide variety of data sources, including databases (SQL, MySQL, PostgreSQL), spreadsheets (Excel, Google Sheets), cloud services (AWS, Google Cloud, Azure), and many more.
Interactive Dashboards:
Data Blending and Preparation:
-
Provides tools for cleaning, blending, and preparing data before visualization. Users can merge data from various sources, perform calculations, and transform data as needed.
Visualization Capabilities:
-
Offers a wide range of visualization types, including bar charts, line charts, scatter plots, heat maps, tree maps, geographic maps, and more. Users can customize visualizations to meet their specific needs.
Advanced Analytics:
-
Includes features for advanced analytics, such as trend lines, forecasting, clustering, and statistical summaries. Users can apply calculations and scripts (including R and Python integration) for more complex analyses.
Collaboration and Sharing:
Mobile Support:
Integration and Extensibility:
-
Integrates with various third-party tools and platforms, including Salesforce, AWS, Google Analytics, and more. Tableau's API allows developers to extend its functionality and integrate it into custom applications.
Types of Tableau Products:
Tableau Desktop:
Tableau Server:
Tableau Online:
Tableau Public:
Tableau Prep:
Use Cases for Tableau:
Business Intelligence:
Financial Analysis:
-
Helps finance professionals analyze financial data, create budget reports, forecast trends, and manage financial performance.
Sales and Marketing:
Healthcare:
To know more about the Tableau, refer to the following documents:
https://help.tableau.com/current/pro/desktop/en-us/gettingstarted_overview.htm
Steps to integrate Mendix with Tableau for Data Visualization:
-
Create a Mendix application and Published OData service.
-
Set up the data in Mendix application.
-
Create a Tableau developer account and connect Mendix OData service.
- Visualizing the data in Tableau.
Step 1: Create a Mendix application and Published OData service.
1. Create a new application in Studio Pro and set up the application security as Production.
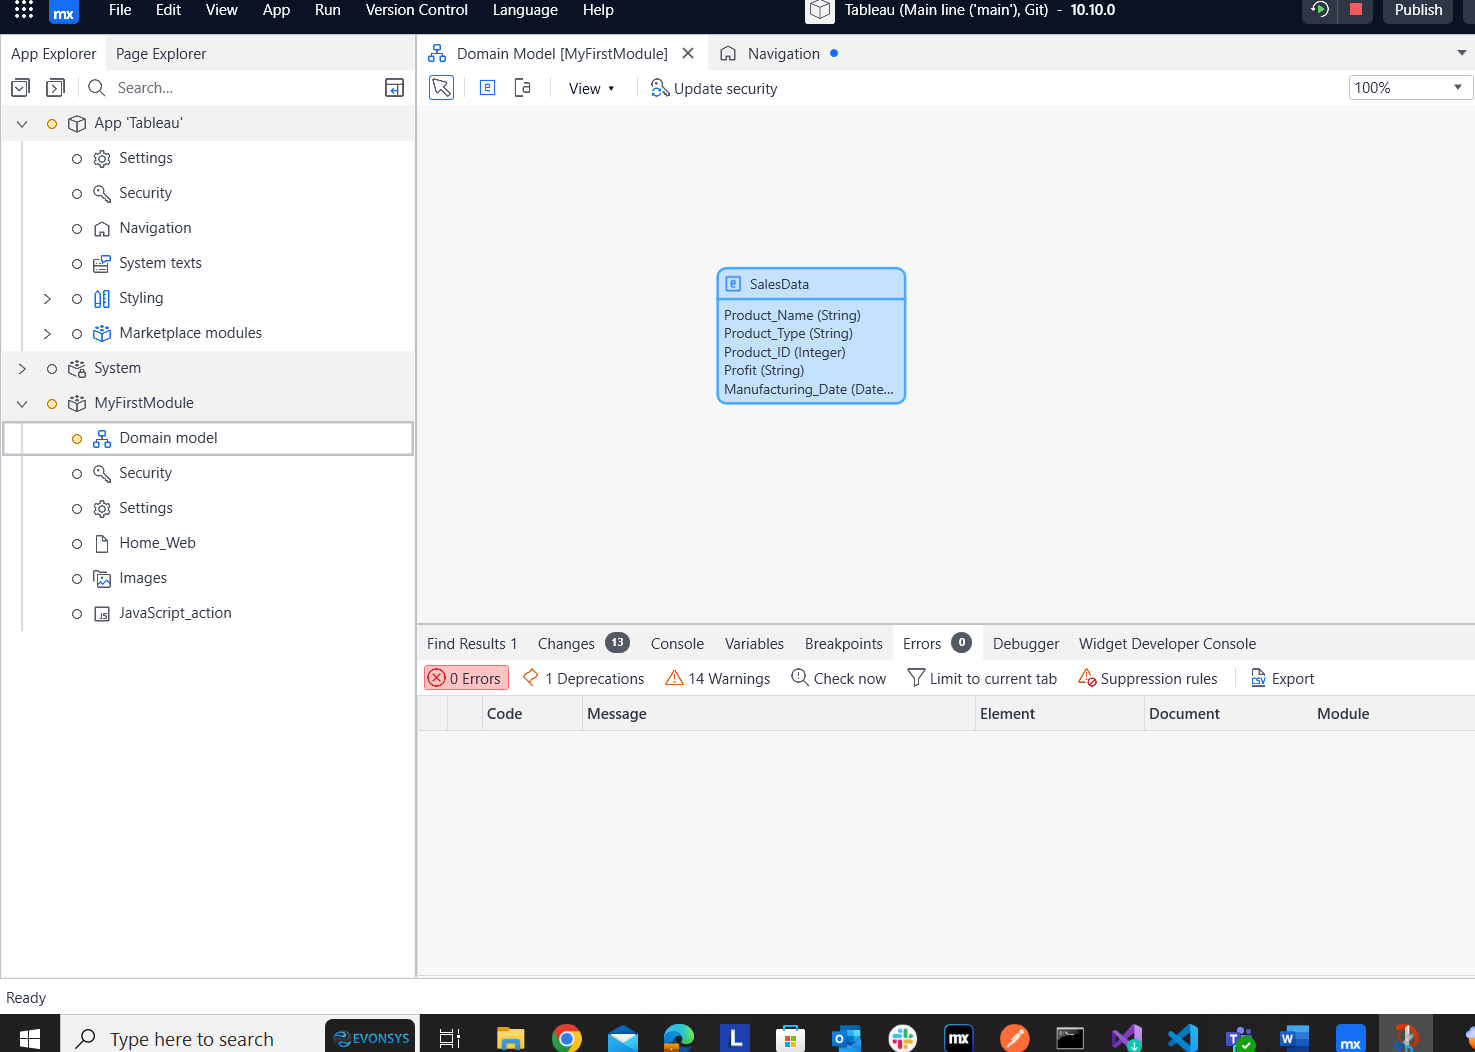
2. Create a new entity in the domain model in the picture below.
-
After creating the entity, provide the entity access to Admin.
-
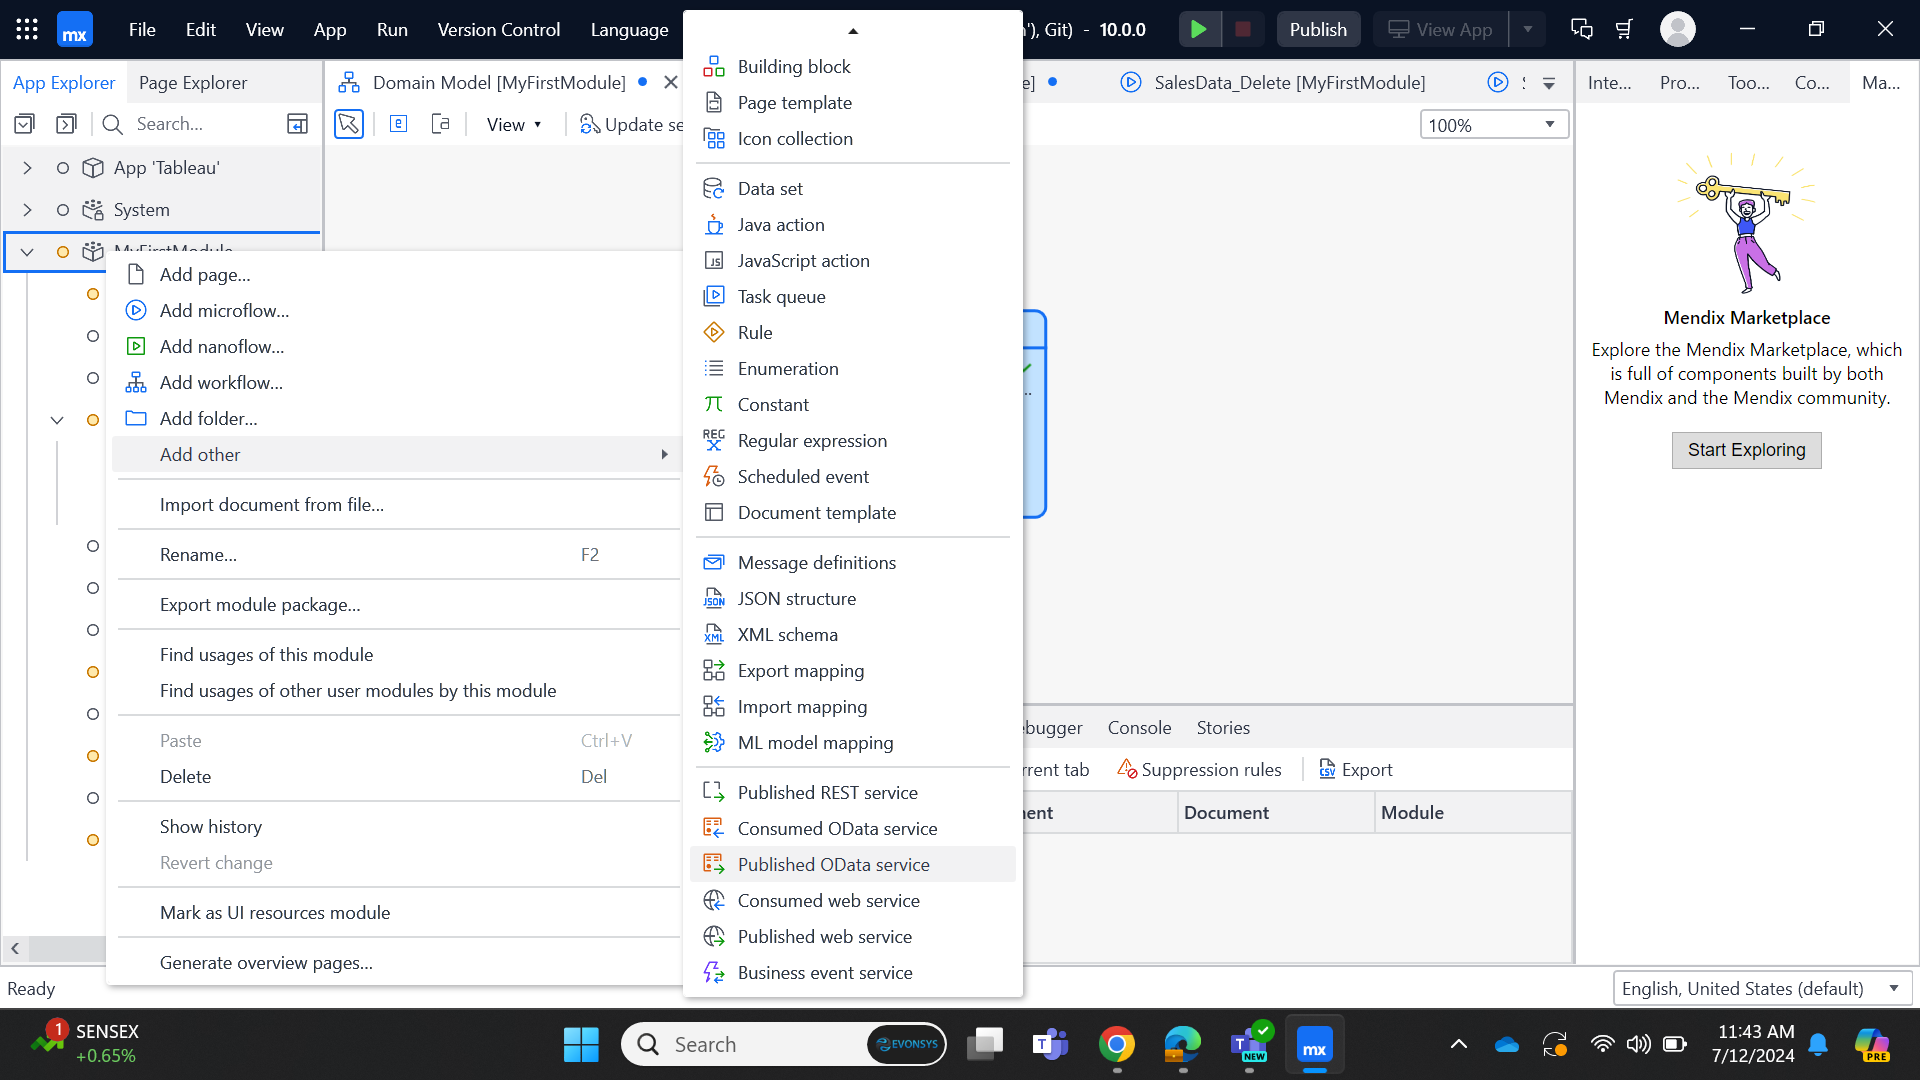
Go to the Project Explorer and right click on the MyFirstModule and open the ‘Add other’ option and click on Published OData service.
-
After clicking on the Published OData service, enter the OData service name and click OK.
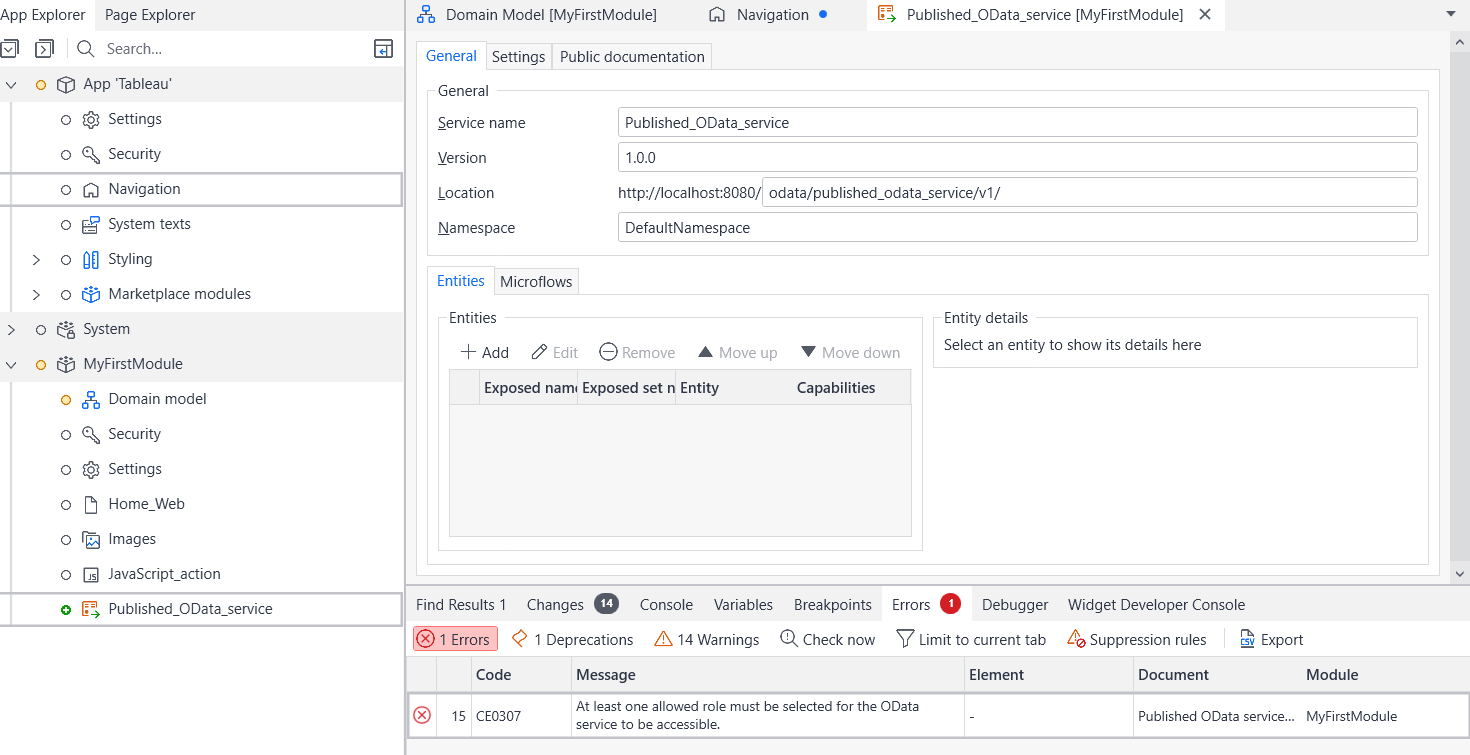
6. After clicking on OK, the Published OData service page will open and display as follows.
-
Here you can add the entity data which you need to use for the OData service.
-
Click on Add in the entity section, select the entity where you want to store data and transfer the data into Tableau.
-
After selecting the entity, the following popup will open. Select the key attribute value, I have used the Sales data entity and Product ID as key, so you need to set the product ID as unique in the domain model entity validation rules.
-
Go to the Settings tab and select one allowed role in security section. Assign security access to the Administrator user role.
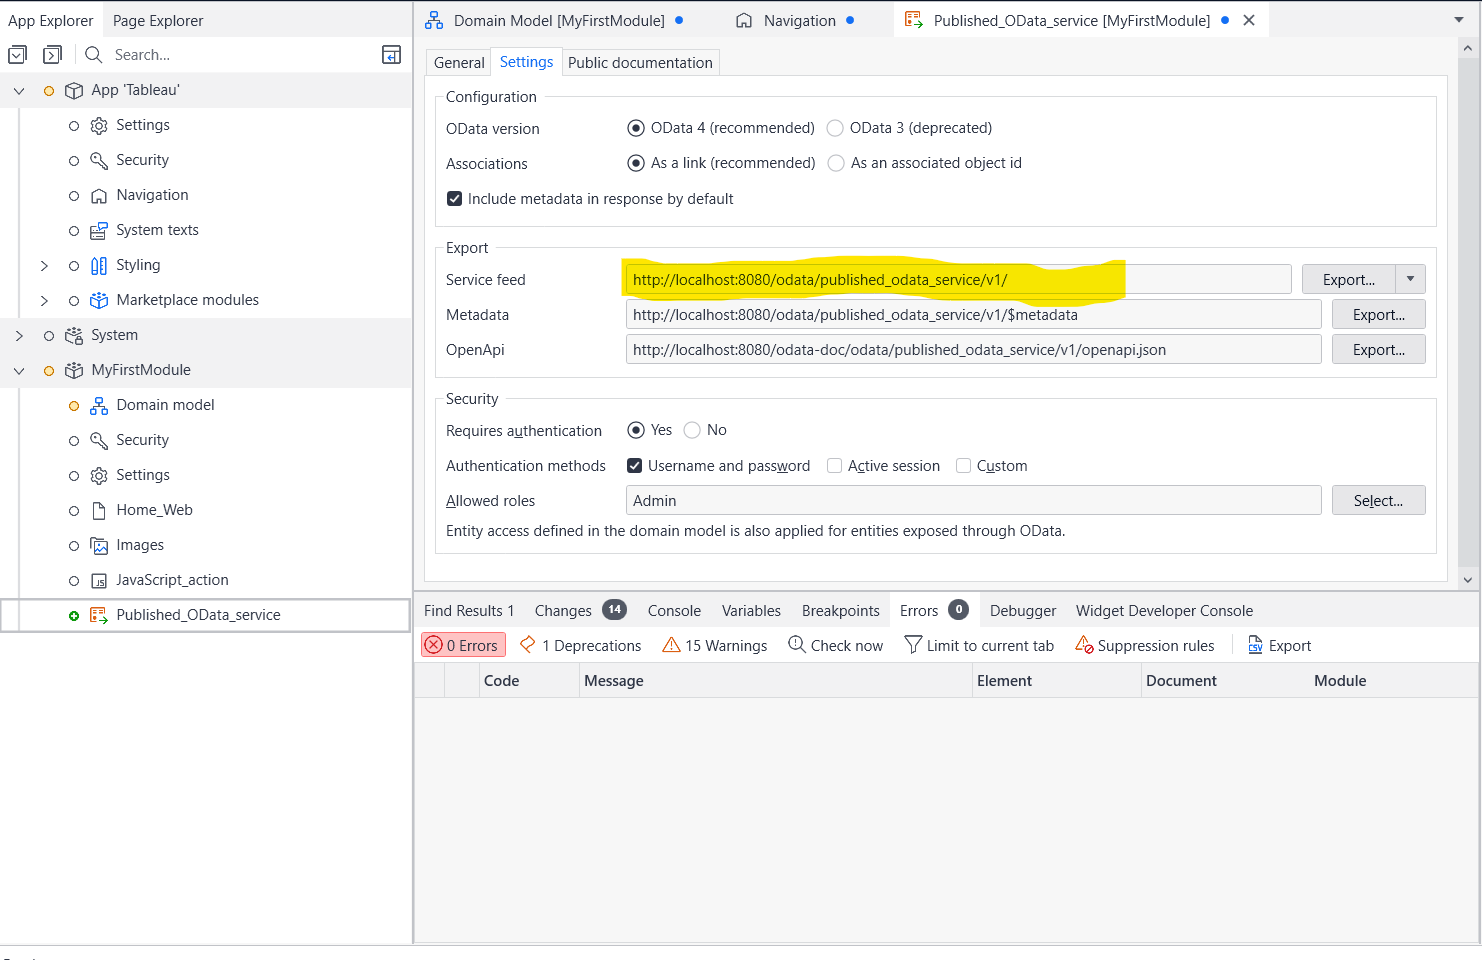
-
Once all the Setup is complete, the OData service settings page will look like the picture above.
-
Copy the service feed URL from the page above.
(Note: This is the main URL you need to use for connecting Tableau, so make sure to keep note of it)
-
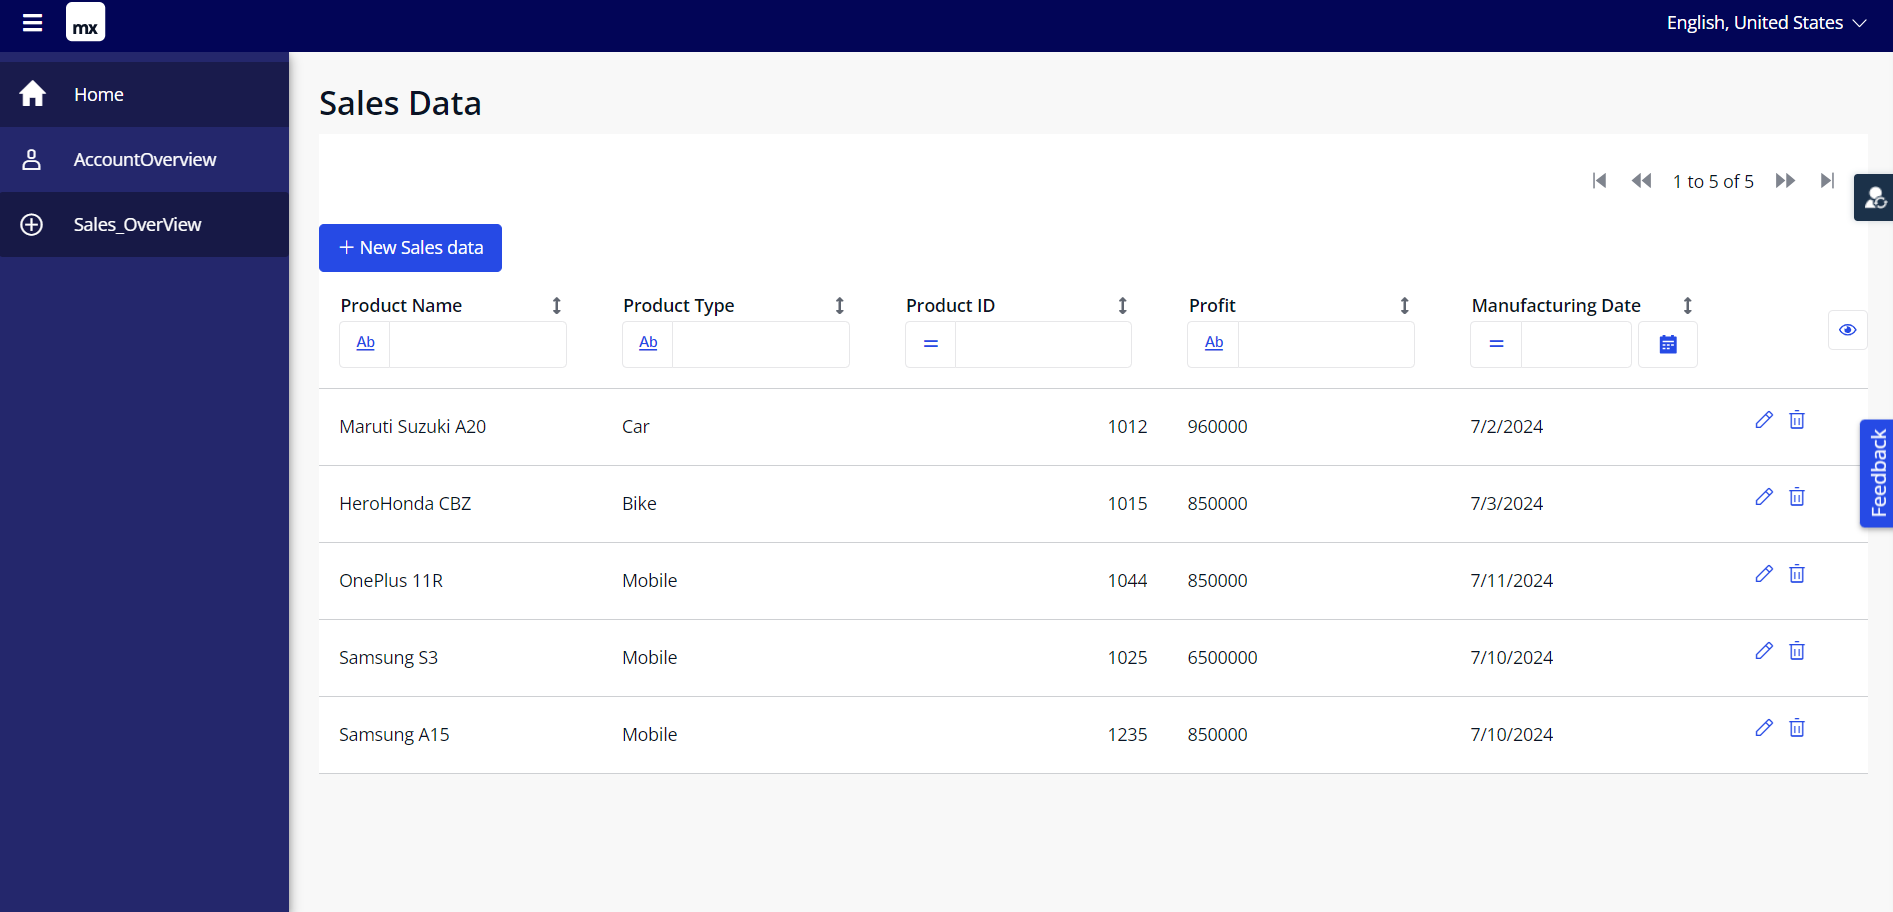
Now Generate the Overview pages for the Sales Data entity to enter and view the sales data of the products in the Mendix application.
-
Once the Overview page is generated, add it to the application navigation and grant page access to the Administrator. Additionally, provide the entity access to administrator with full read and write access.
-
Once you have set up all the configurations and security access, publish the application, as the local host cannot use Tableau to connect to OData.
-
After publishing the application, open the sandbox to copy the sandbox URL and save it for future reference.
https://tableau102-sandbox.mxapps.io/
Step 2: Set up the data in Mendix application
-
Create an Administrator user and enter some sales data in the application.
-
Open the Overview page in sandbox and add the Sales data.
-
I have created the following data in my sandbox; you can refer to the picture below.
4. Replace the Service feed URL that you obtained in point no. 12.
Service feed URL: http://localhost:8080/OData/published_OData_service/v1/
Sandbox URL: https://tableau102-sandbox.mxapps.io/
Replace the service feed URL with sandbox then the final URL will look as follows
https://tableau102-sandbox.mxapps.io/OData/published_OData_service/v1/
Note: This is the URL you need to use for connecting the Mendix application data to Tableau by using OData connector.
Step 3: Create a Tableau developer account and connect Mendix OData service
- Go to the following link.
https://www.tableau.com/trial/tableau-software?openExternal=true
https://www.tableau.com/
- Click on Try Tableau for free, it will open the following page.
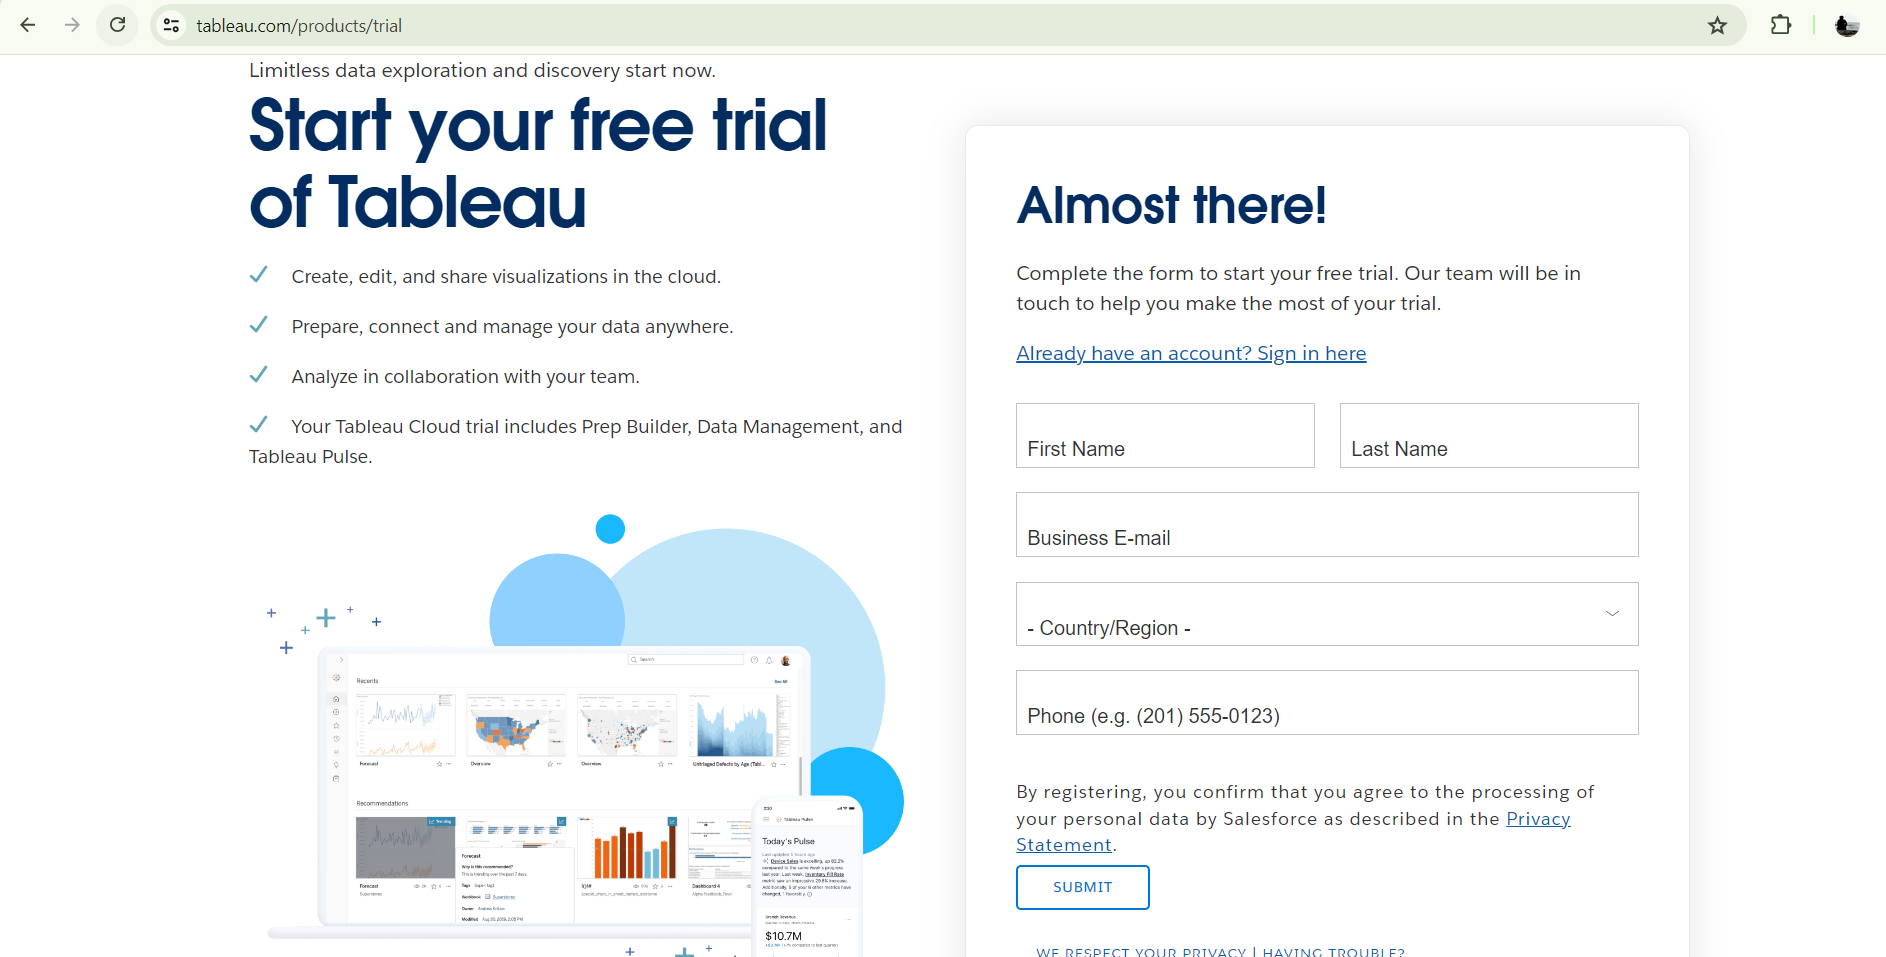
-
After entering all the details, click the submit button. A verification email will be sent to your register email ID.
-
Go to email and click ‘Activate Your Account’ to start the free trial of Tableau.
-
After clicking on verification, set the password for your tableau account.
-
After successfully creating your account, go to the following link.
https://www.tableau.com/products/cloud-bi. Click on ‘Start free trial’ button and create a Tableau cloud account to visualize your Mendix data in tableau.
-
Go to the following Link and sign in with your account. This will open the Tableau Cloud platform dashboard page. https://sso.online.tableau.com/public/idp/SSO
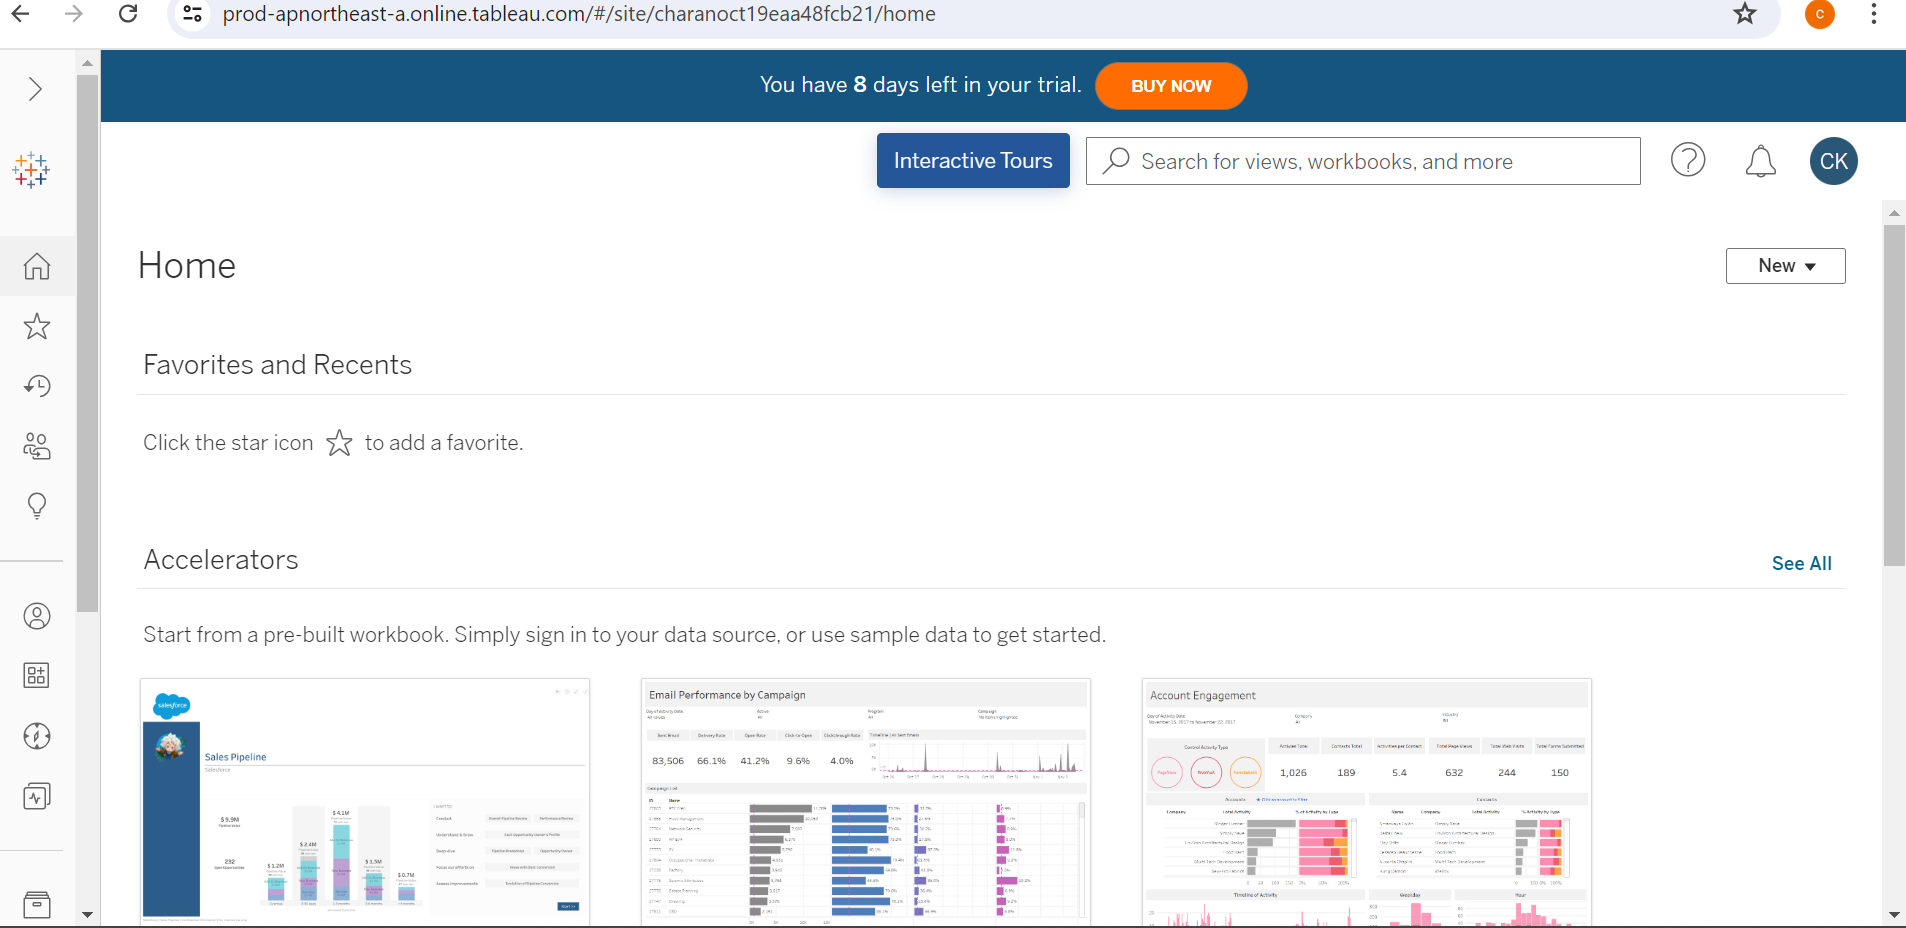
8. Click on the New button located on the right side of the dashboard. This will open a drop menu to select the workbook.
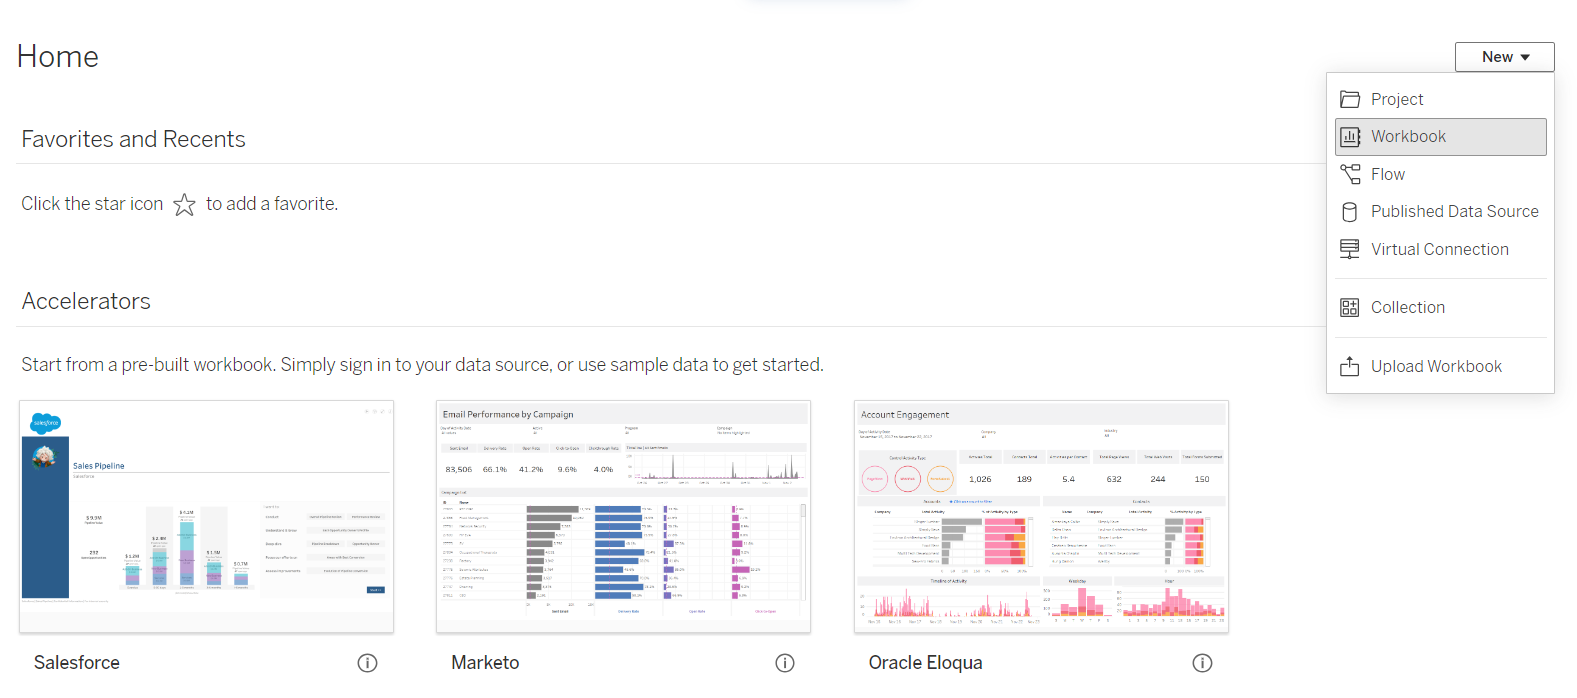
9. After selecting the Workbook, it will open the following page.
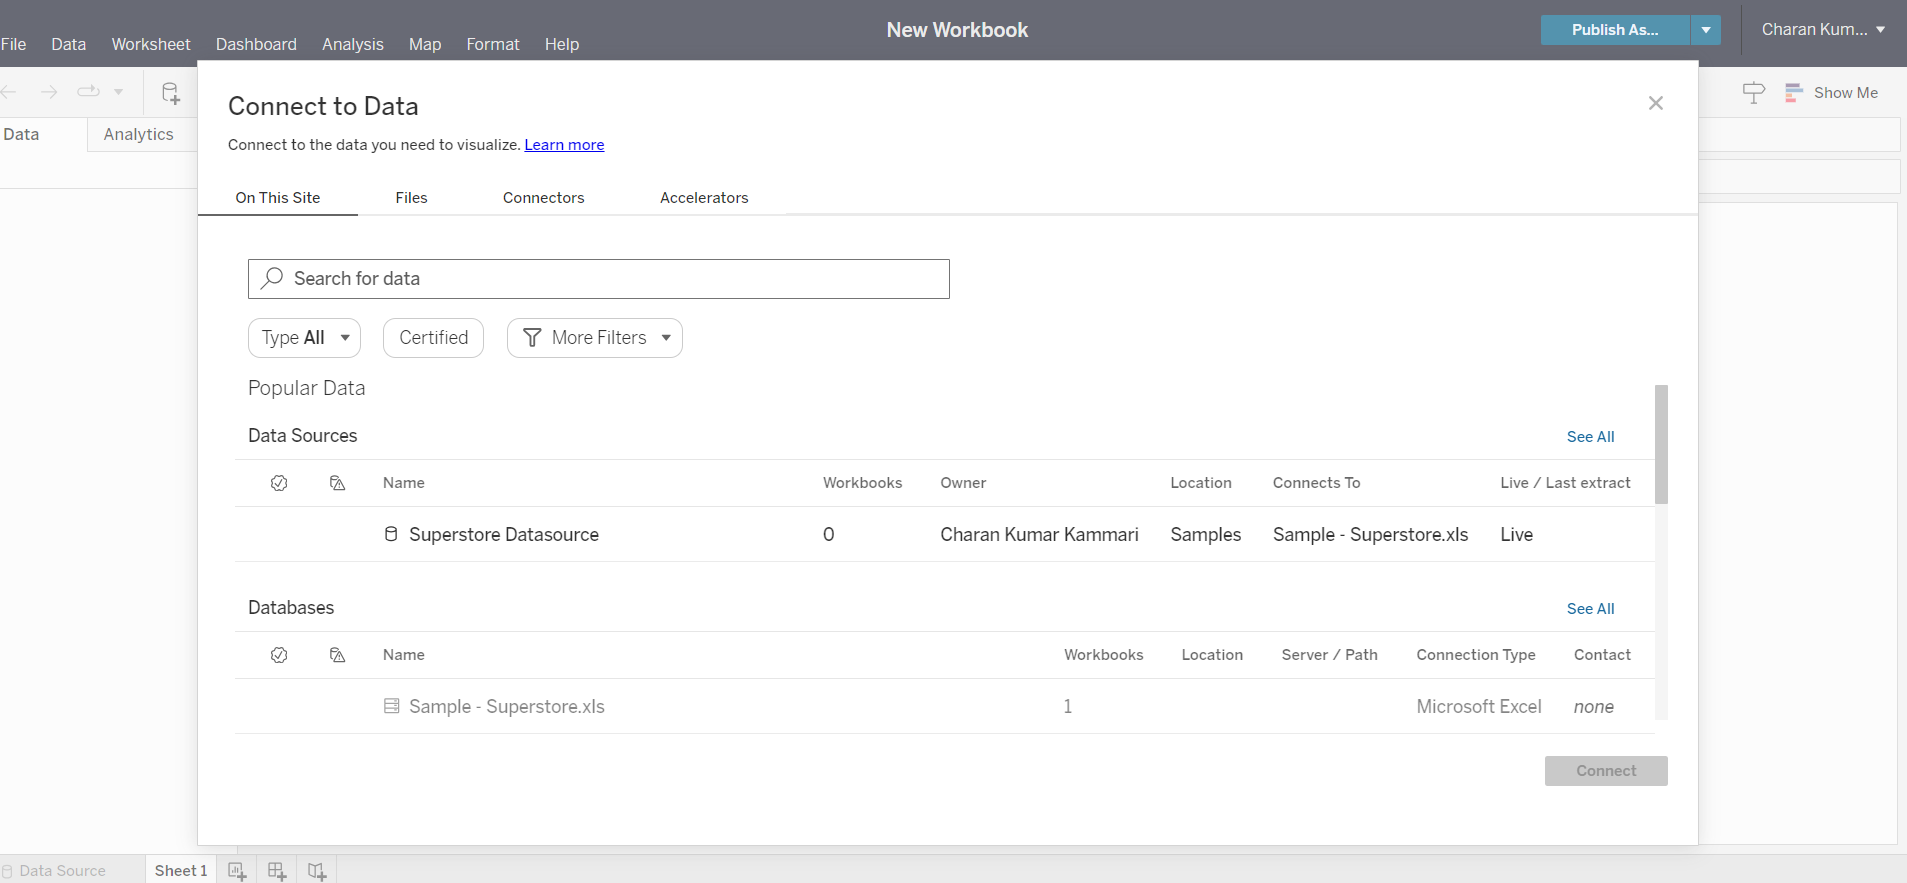
10. Go to the Connectors tab and select OData, it will open the following popup page.
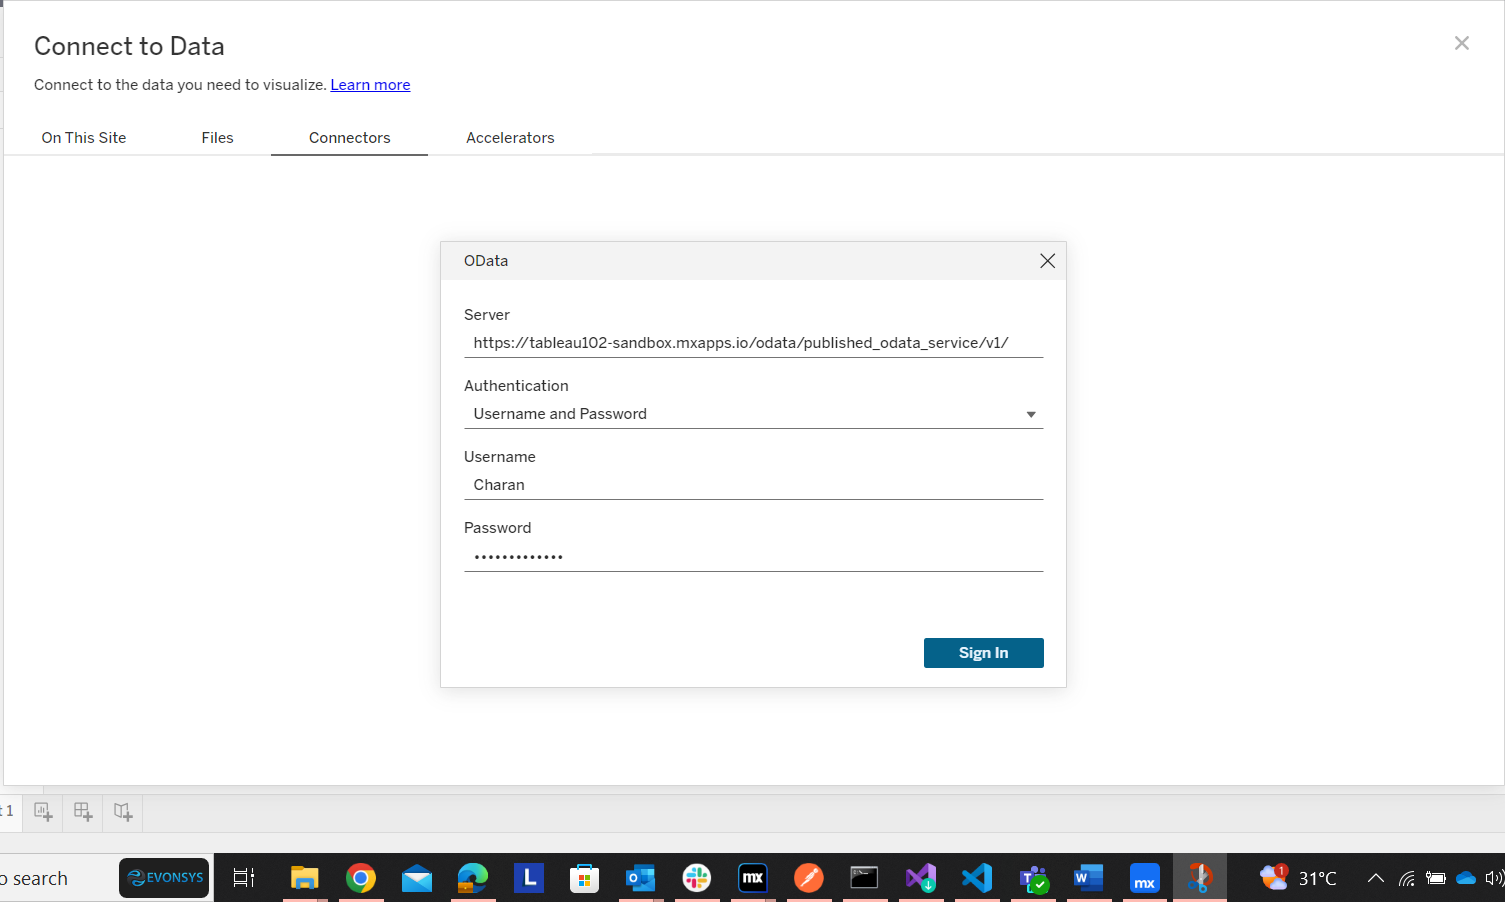
-
Fill in the details of OData in the window above.
Server URL: It is the URL that was generated in Step 2, Point number 2, and it looks like the following URL.
https://tableau102-sandbox.mxapps.io/OData/published_OData_service/v1/
Username and password: Use the Administrator username and password that you created earlier in the Mendix sandbox.
-
After entering the details, click the Sign in button, and the following workbook dashboard will open.
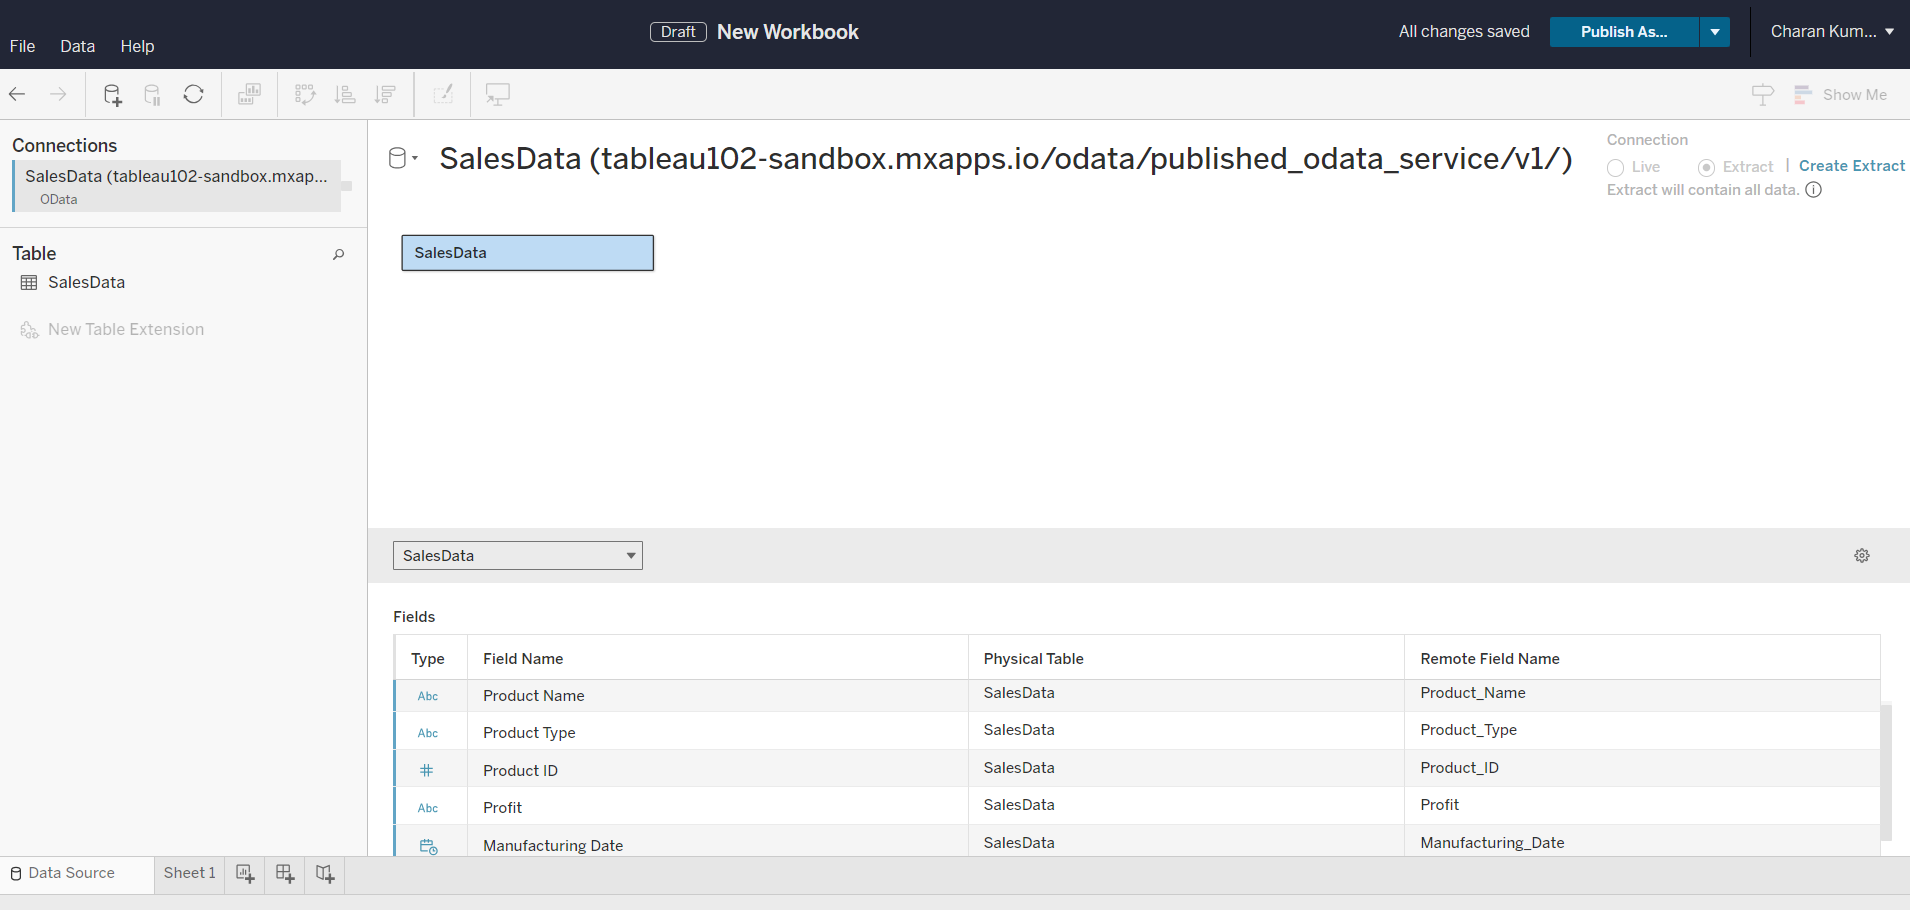
-
Here you can see the entity details and attributes created in the Mendix application, and it will connect the Published OData service to your Tableau account.
-
Click on Create Extract, which is located in the top right corner.
-
After completing the data extraction, click on Sheet 1 in the bottom menu to open the following dashboard page.
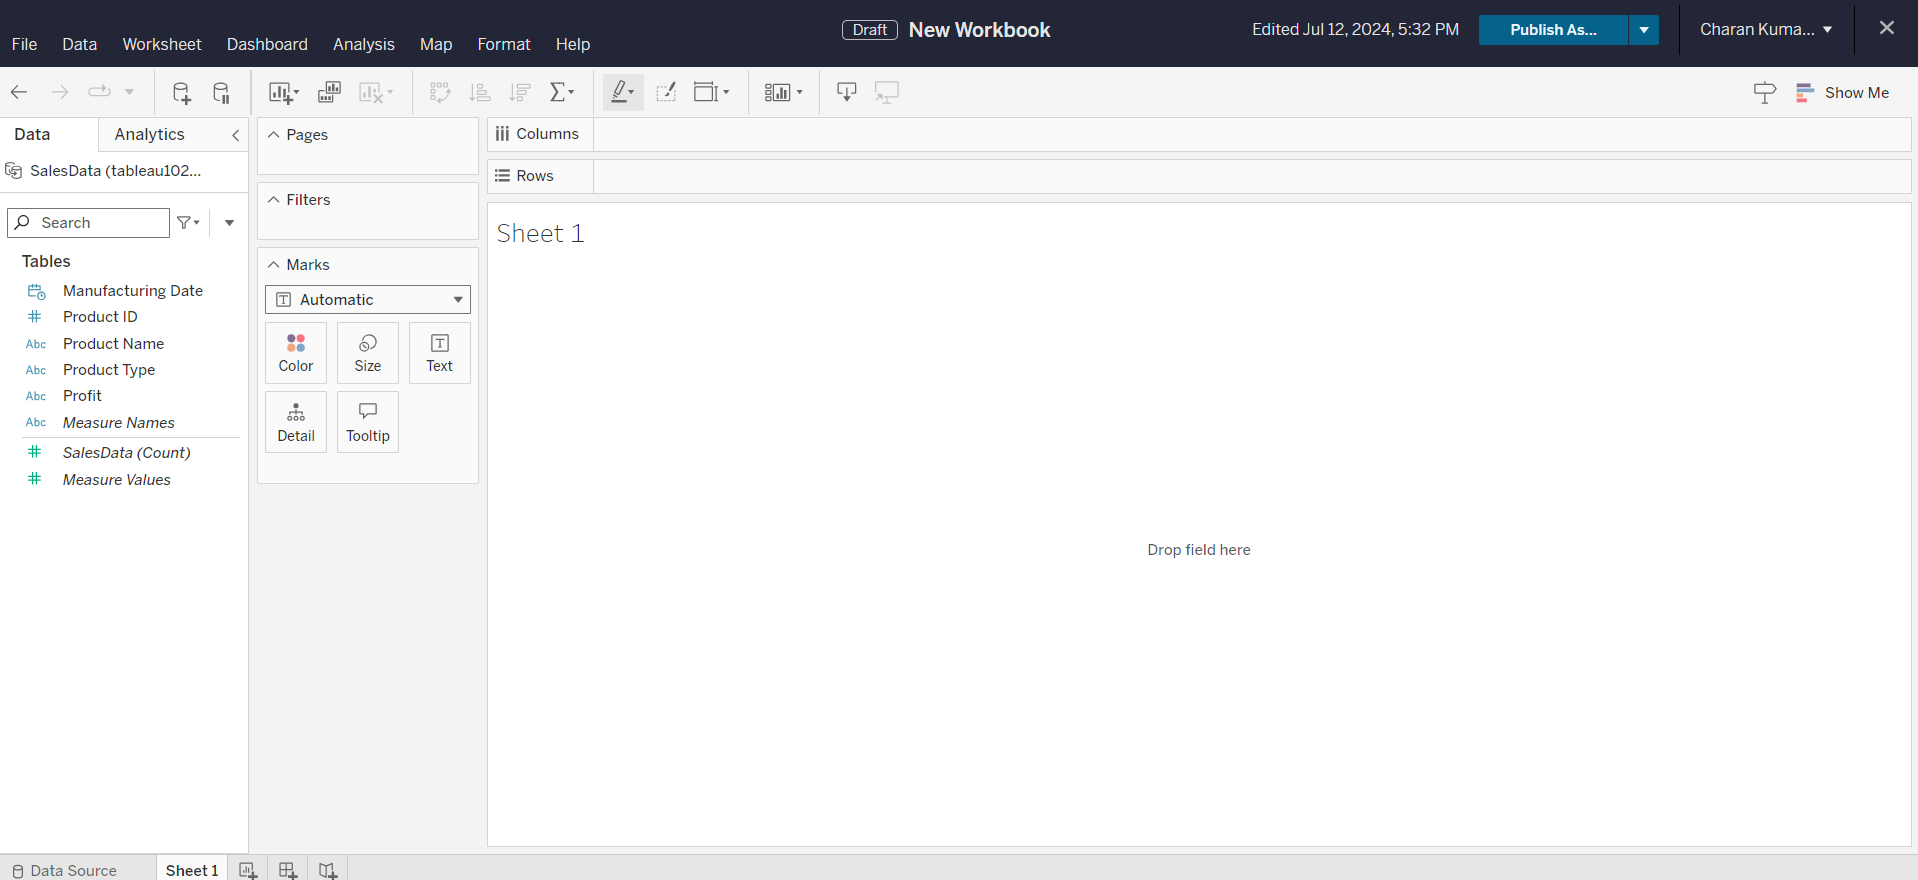
-
Now you can drag the fields in Sheet 1 as per your requirements. After dragging all the fields, the sheet will look as shown in the below picture.
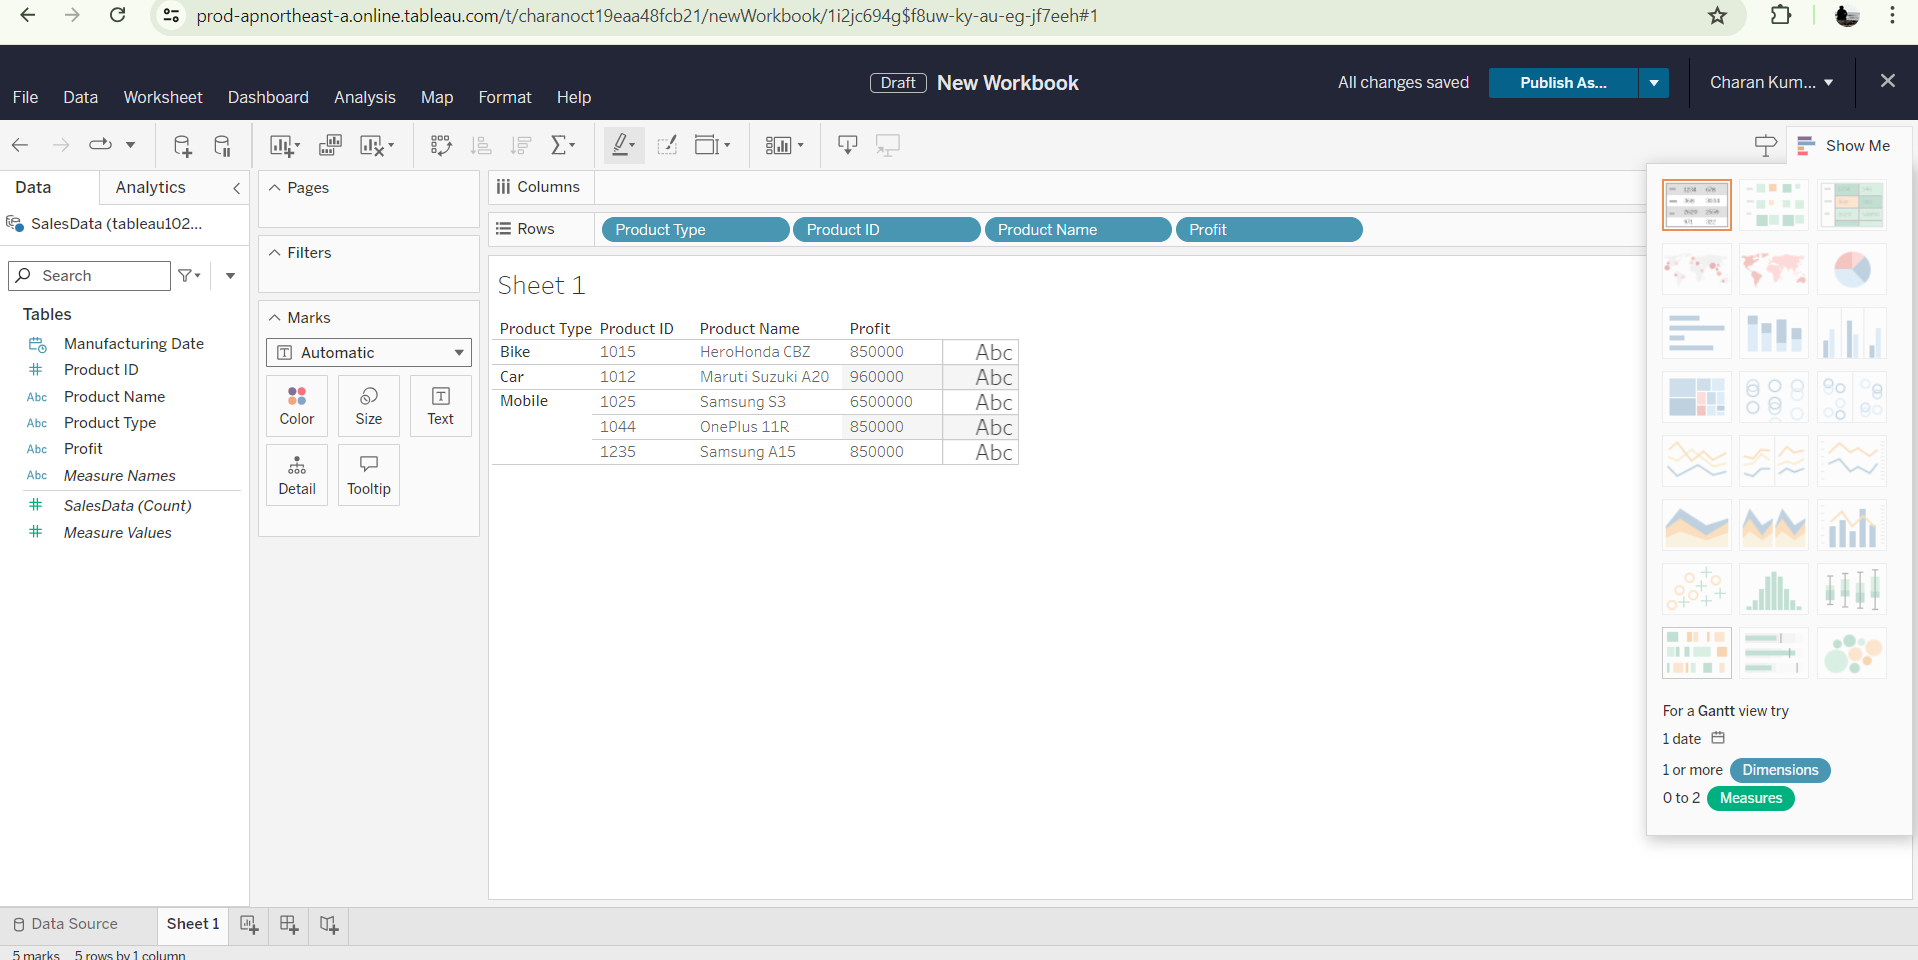
-
Here you can see the data I have provided in the Mendix application sandbox.
-
As this is a trial version access, I don't have access to all the visualization features.
-
If you want to use all the Tableau Cloud features, you can subscribe to Tableau.
-
After creating the sheets, you can now publish the workbook to provide access to all your organization employees.
Conclusion:
Integrating Mendix with Tableau using OData services offers a powerful solution for businesses looking to leverage data visualization and business intelligence capabilities. This integration allows for seamless data flow between Mendix applications and Tableau, enabling users to gain valuable insights and make data-driven decisions efficiently.

